The full DMAIC toolkit,
in your browser
63 statistical studies organised by Define, Measure, Analyse, Improve and Control — each one with its own theory, formulas and worked example. Nothing to install.
Register with an email and start straight away · No payment details
Built for people doing the project
Not a general-purpose statistics package with a Six Sigma menu bolted on. The whole tool is arranged the way a DMAIC project actually runs.
Theory next to every study
Each analysis ships with its own theory panel: assumptions, formulas, decision rules and a worked example. Learn the method while you apply it.
Referenced methodology
Studies cite the standard statistical literature they are based on, so results can be traced back to a published source.
Nothing to install
Runs in the browser. No desktop client, no license server, no admin rights needed on your machine.
Your data stays yours
Datasets are never stored on our servers. They live in your browser session and are gone when you sign out.
Every phase covered
Pick a phase to see what is available today. All of it is built and working — nothing on this list is a placeholder.
Measure
16 studies- ✓Cause & Effect (Fishbone)
- ✓Descriptive Statistics
- ✓Graphical Summary
- ✓Normality Test
- ✓Capability: Normal, Sixpack, Nonnormal
- ✓Capability: Binomial, Poisson
- ✓Distribution Identification
- ✓Histogram · Dotplot · Boxplot · Time Series
- ✓Gage R&R (Crossed)
- ✓Attribute Agreement Analysis
Reports you can put in a review
Real output from the application, not mock-ups.
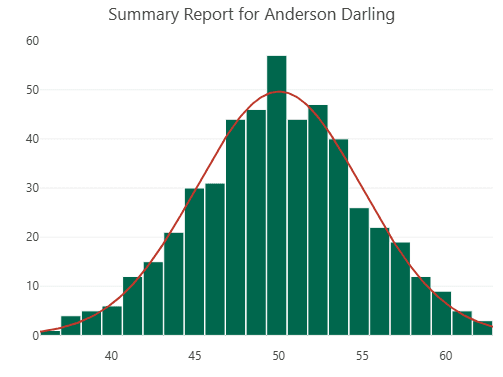
Graphical Summary
Histogram with fitted curve, boxplot, confidence intervals for mean and median, and Anderson-Darling normality test in a single output.
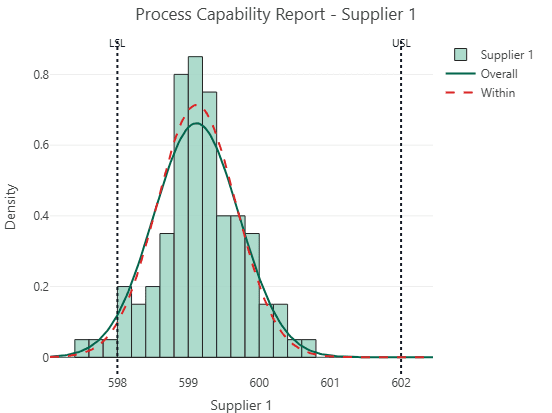
Process Capability
Cp, Cpk, Pp, Ppk, PPM and sigma level, with within and overall variation shown against your specification limits.
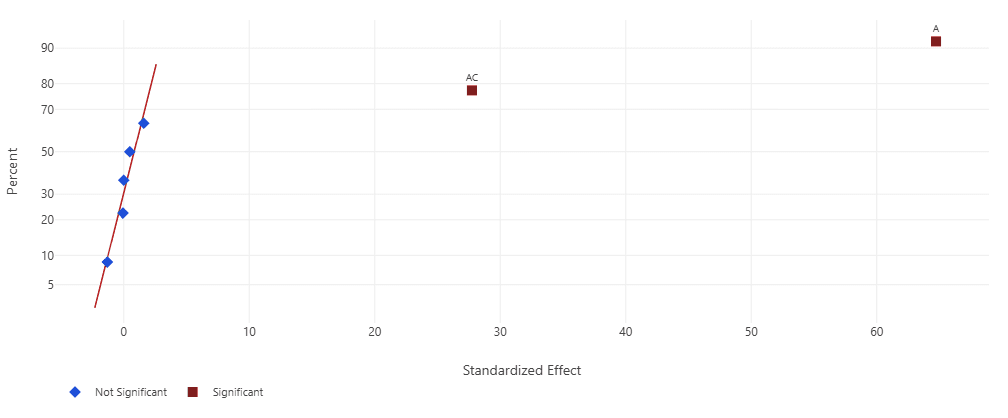
Design of Experiments (DOE)
Full and fractional factorial designs with main effects, interaction plots, and ANOVA to pinpoint the factors that truly drive your response.
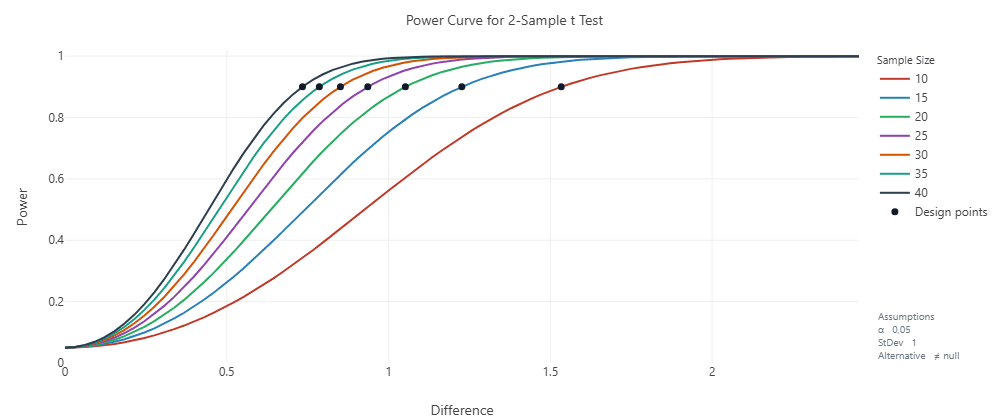
Hypothesis Testing
Full battery of parametric and non-parametric tests, with assumption checks and plain-language conclusions.
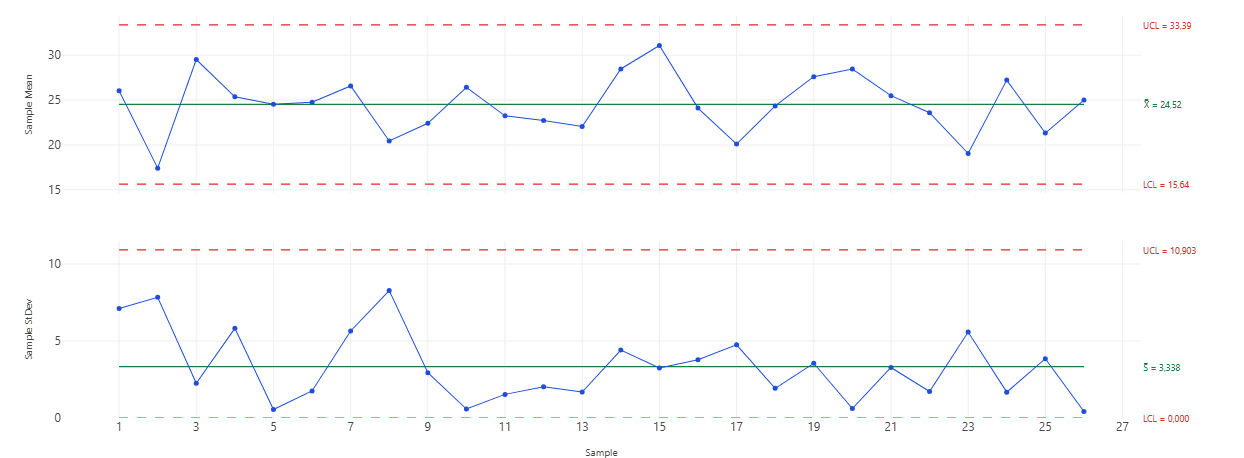
Control Charts
I-MR, Xbar-R, Xbar-S and attribute charts with Nelson rules applied automatically to flag special causes.
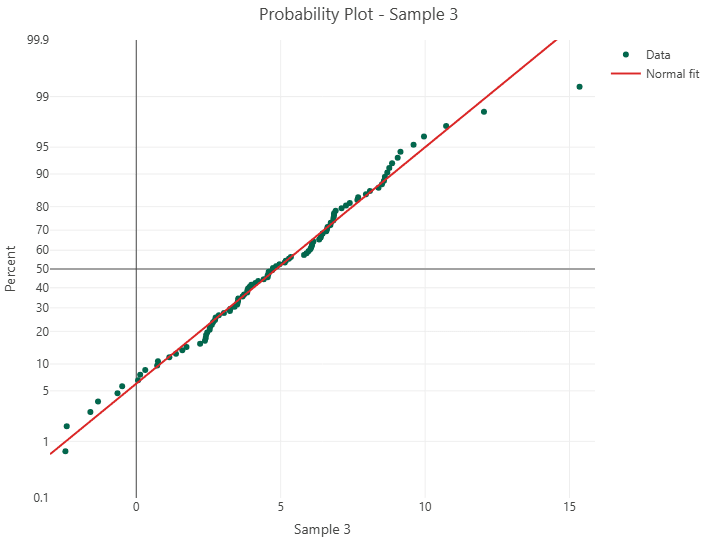
Normality Test
Probability plot with Anderson-Darling statistic and p-value, so you know which test is valid before you run it.
How it works
Three steps, and your data never leaves your machine unless you decide otherwise.
Load your data
Paste or type your measurements into the worksheet, or restore a previously saved JSON file from your computer.
Run the study
Choose the phase, pick the study, set your options. Read the theory panel if you want the reasoning behind the method.
Save what you need
Export your session as a JSON file to your own machine. Nothing is kept on our servers, so bring it back next time you sign in.
A note on saving. Sessions are not stored server-side. That is deliberate — it keeps your process data under your control — but it means you need to export your work before signing out, and load it back in on your next visit.
Free while in early access
Create an account with your email and you get everything. No payment details, no trial countdown.
Registration is all that is required
- ✓All 63 studies, every DMAIC phase
- ✓Theory, formulas and worked examples included
- ✓Export and reload your sessions as JSON
- ✓No install, runs in any modern browser
- ✓No credit card, no payment details
A paid annual plan is planned for the future. Accounts created during early access will be told well in advance, and nothing will start charging without you actively choosing it.